Topics
Mark Twain said “There are lies, damned lies, and statistics.” That may be true. Well, consider yourself an interpreter of those lies. Columns representing numbers are pretty lame. As designers, it is our job to represent information in an interesting and informative manner. Luckily, Adobe has provided some really great graphing tools in Illustrator. This is what we are going to explore this week.
About Illustrator Graphs
An Illustrator graph is special type of live, grouped object. When you select a graph, Illustrator’s Object Type Indicator tells us it’s a live graph object.
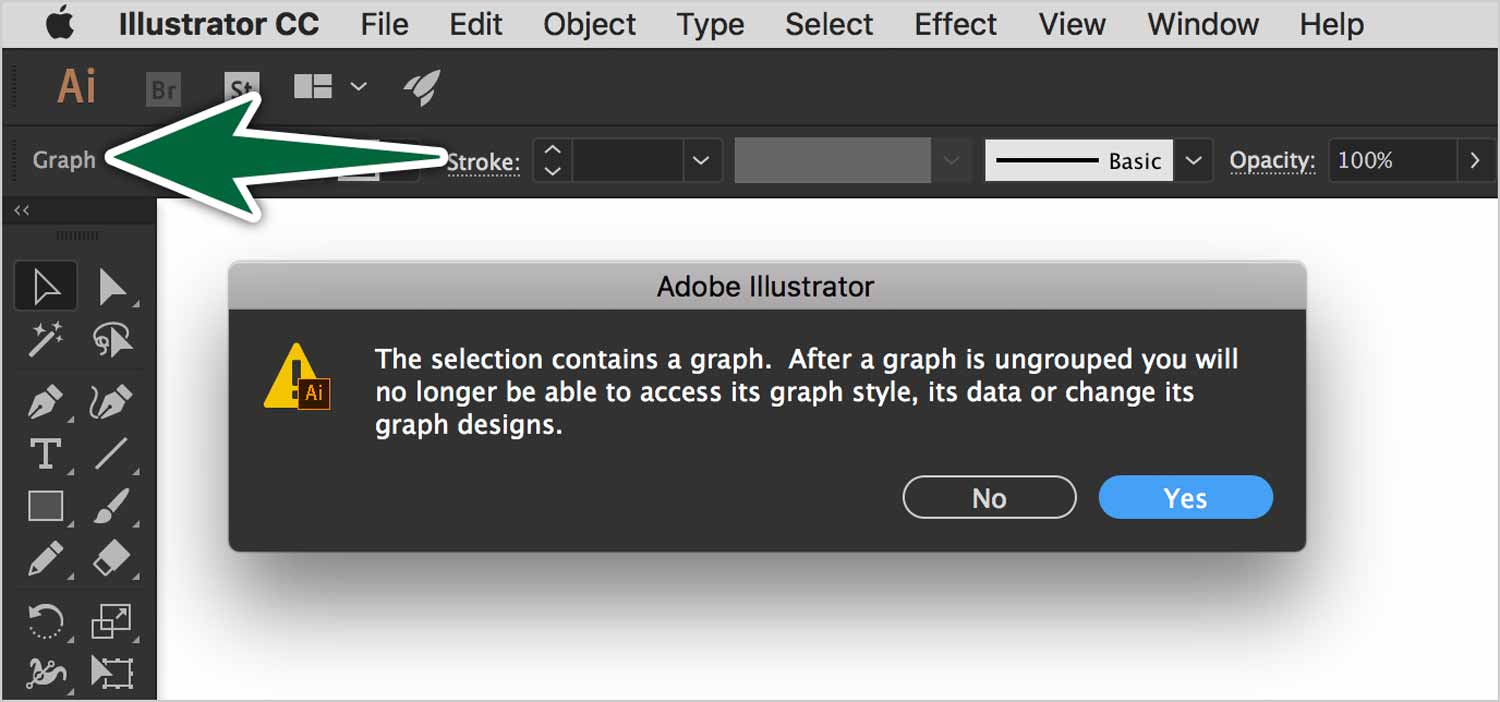
If you ungroup a graph, Illustrator will put up a warning that it won’t be live anymore. This means the data won’t be editable. If you absolutely must ungroup a graph, make a copy of it first, so you can go back to the live graph if necessary.
How to Draw a Graph
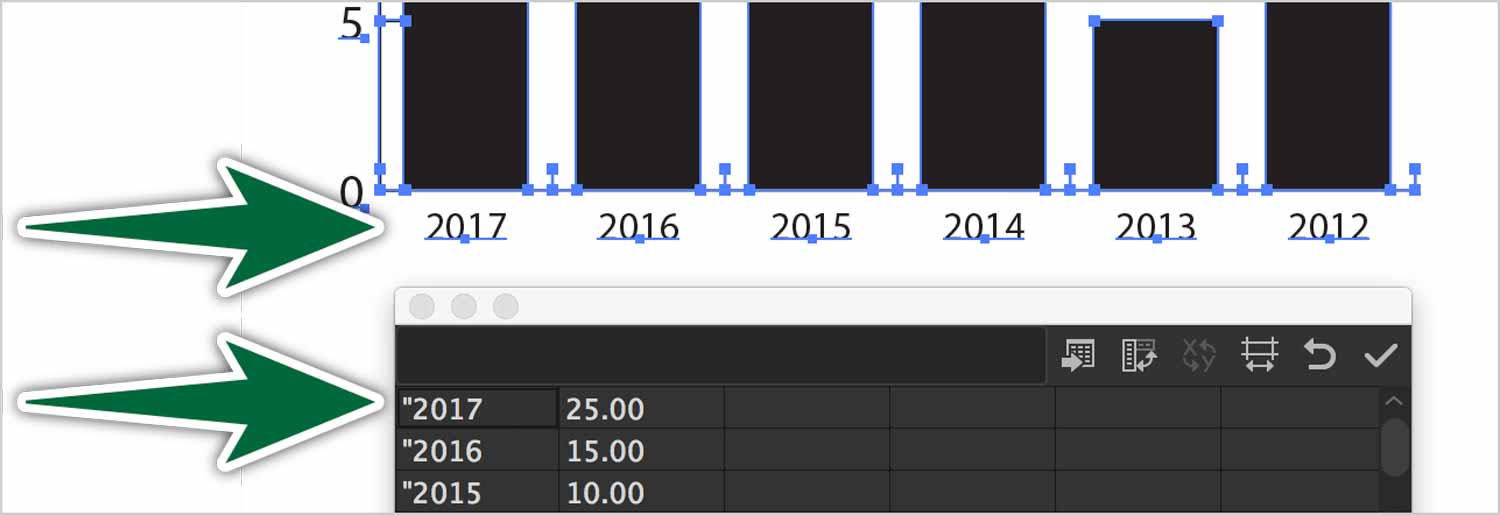
To draw a graph, it’s important to have data well formatted ahead of time. It can be in a text file or a spreadsheet. Then, simply take one of the graph tools and draw a rectangle where you want the graph. The data window will open automatically. Type, or better yet, paste your data into the data window. Once you’re done, hit the check mark button or hit Enter (not Return).
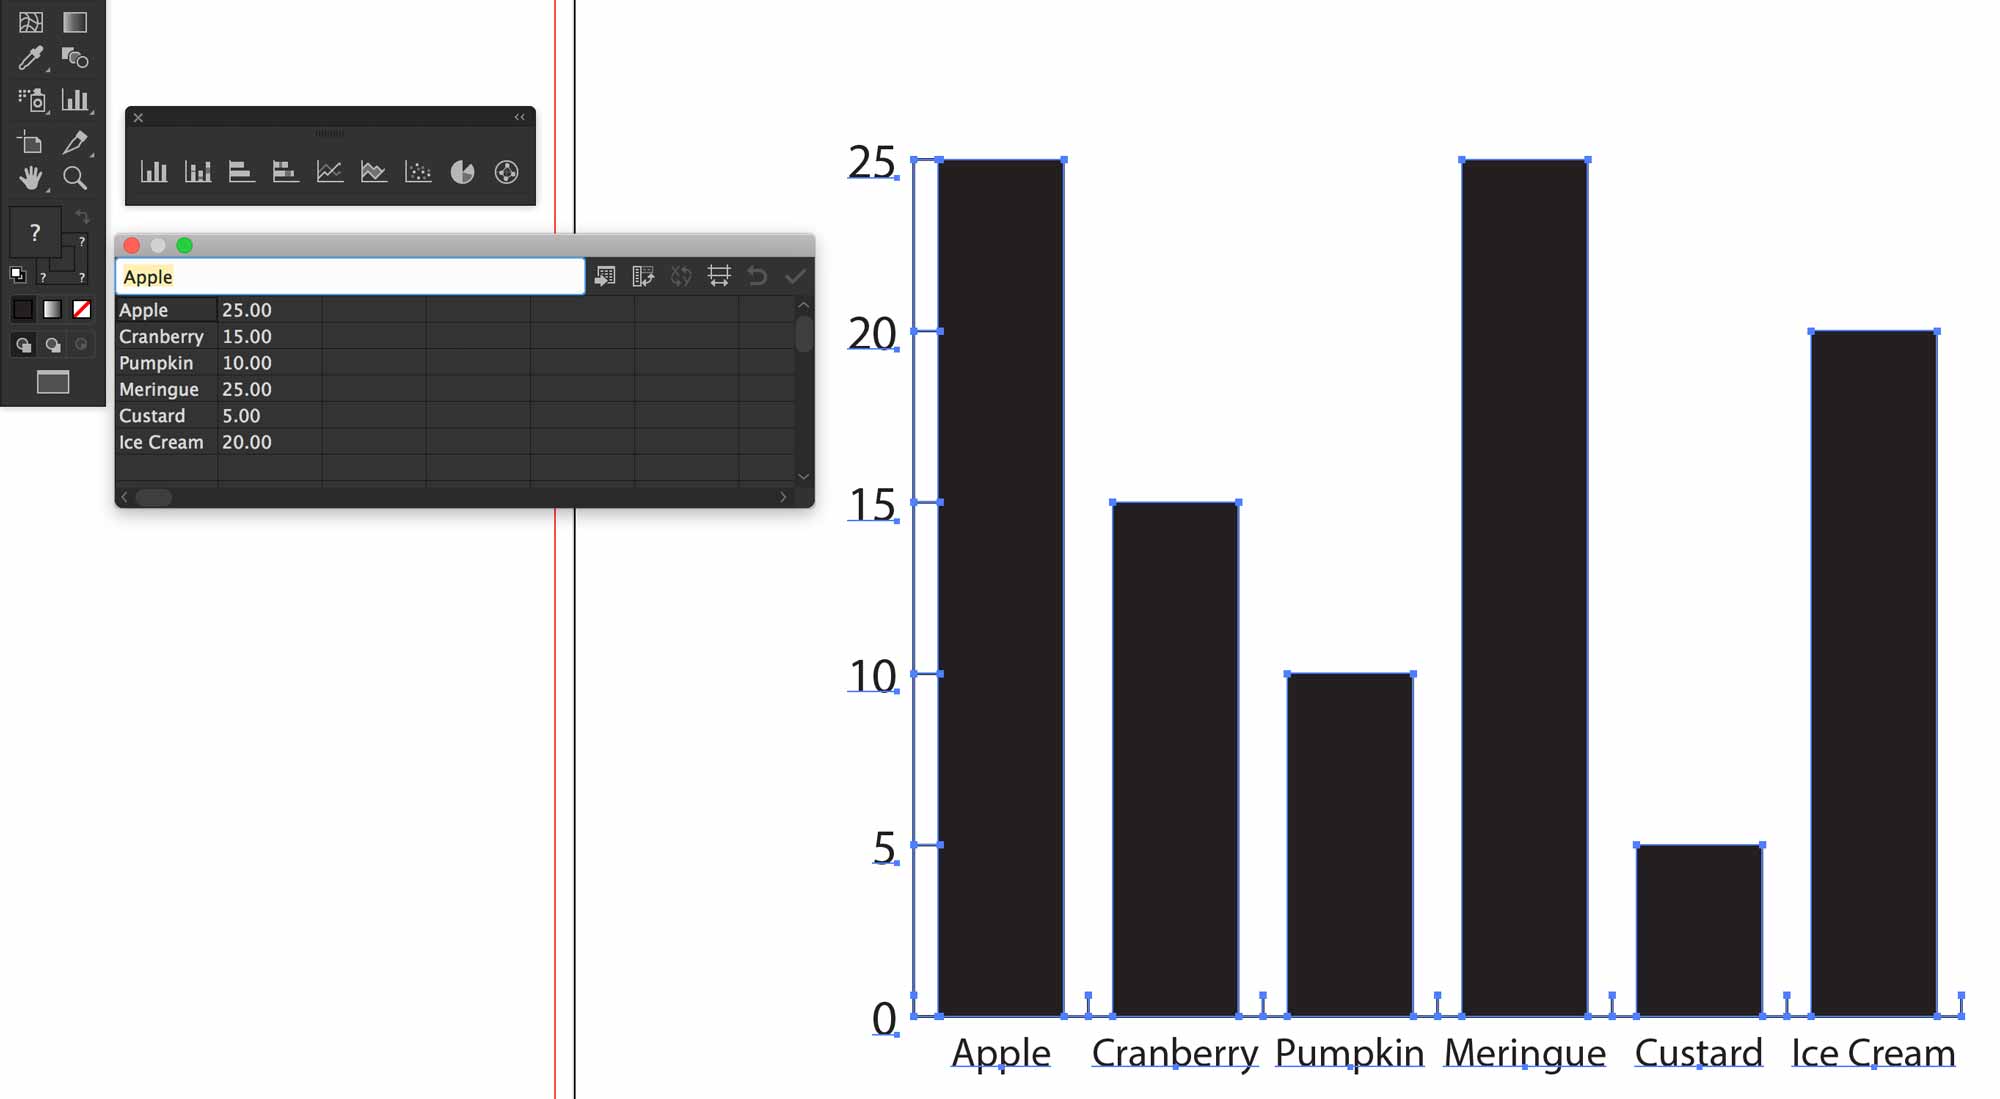
Once you hit Enter, you’ll get a live preview of the graph. If you find you’ve entered the data on the wrong axis, just hit the Transpose button in the graph window.
Working with a Spreadsheet
Typing your data manually is fine if it’s a small graph as shown above. If you have something more intricate, it’s better to have your data in a spreadsheet.
Clicking on the Import Data button in the data window rarely yields satisfactory results.
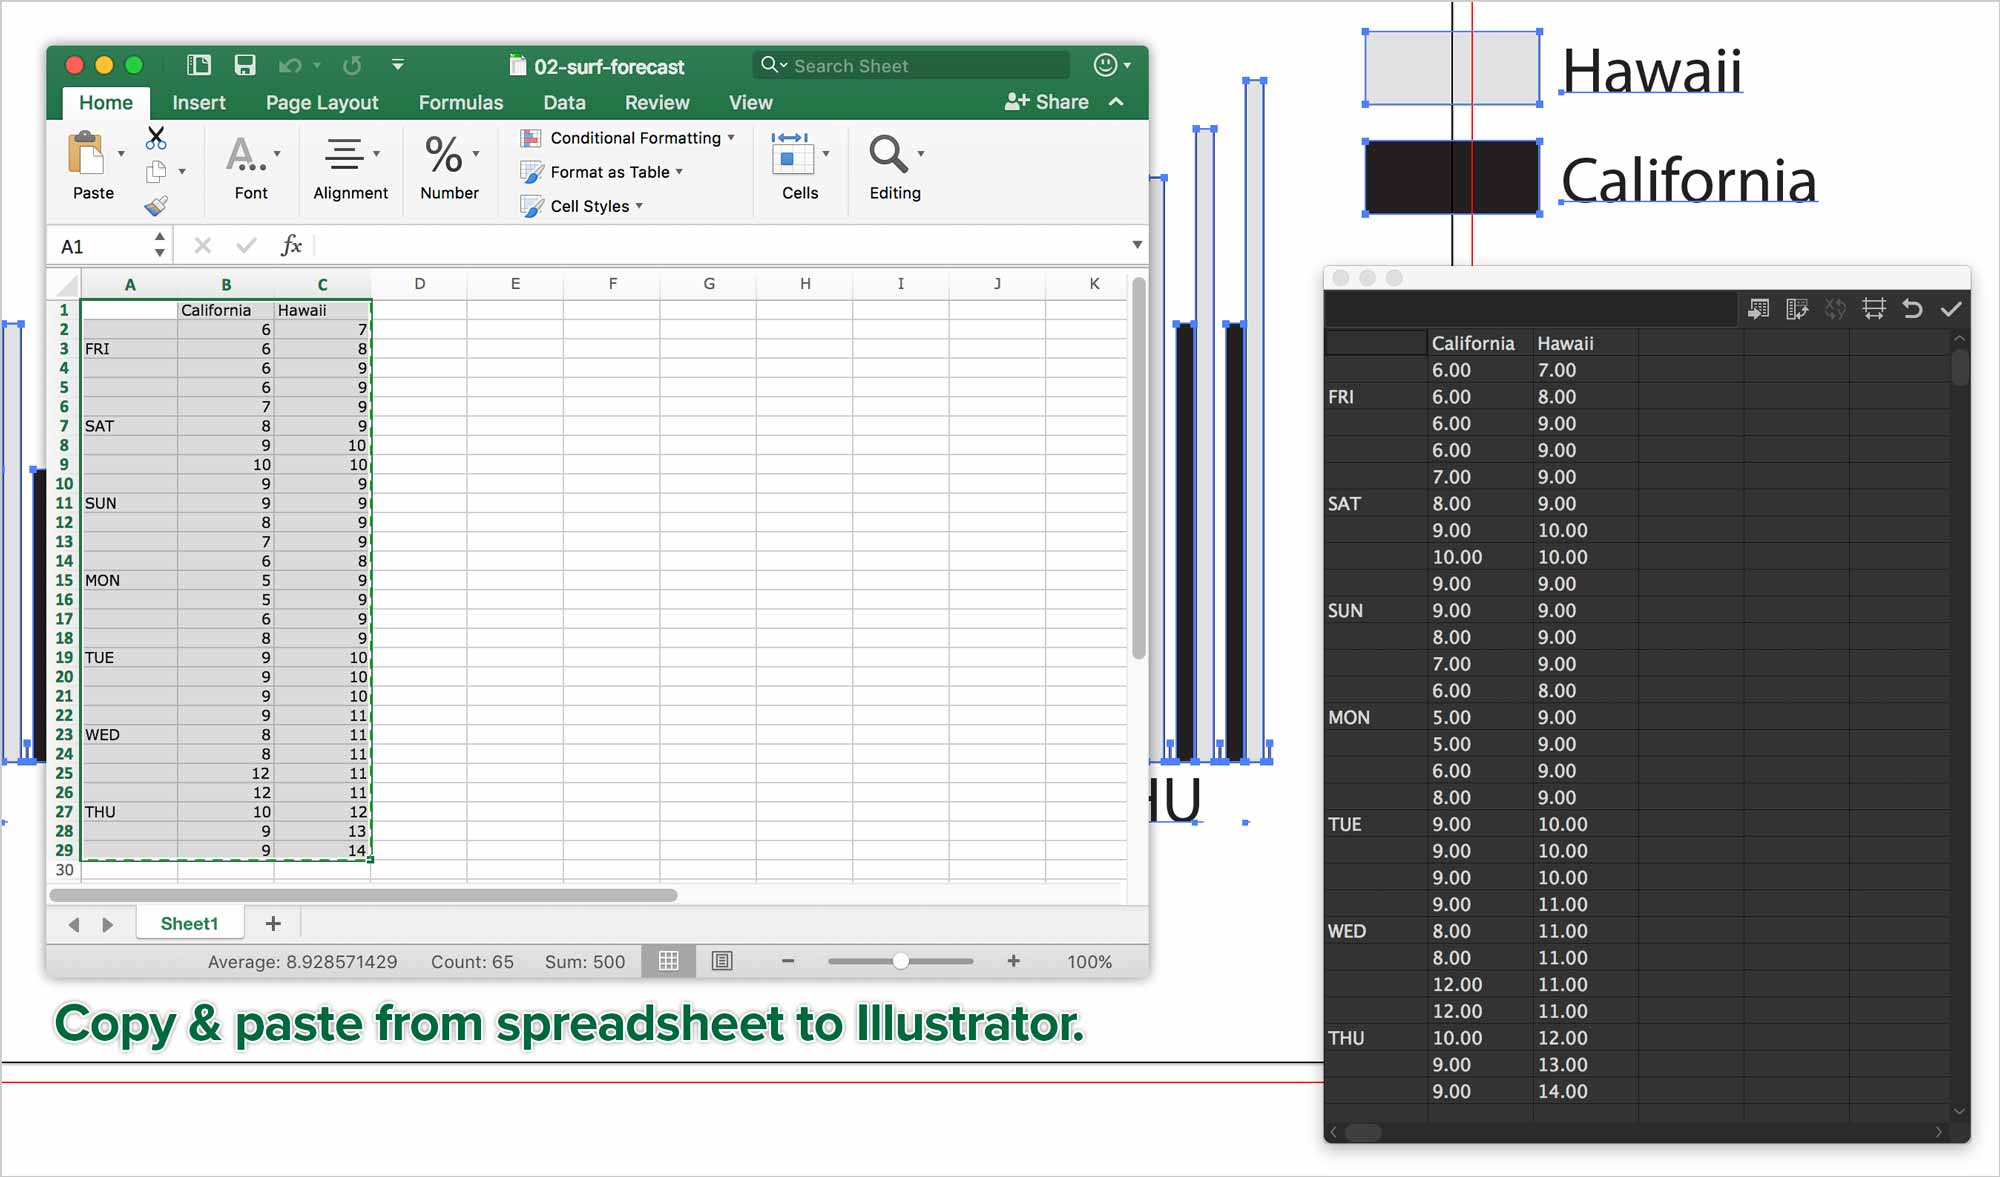
It’s best to open the spreadsheet to copy/paste the data into the Graph Data Table. You can then click the Apply button (check mark). The graph will be drawn on the artboard. If things don’t look right, click the Revert button. Fix your data file and try again.
You can edit the text in the graph at any point. Simply select it with the Group Selection Tool. Change the text formatting until you are satisfied.
To go back to make changes to the graph, select it with the selection tool and double-click on the graph tool. You can also control-click on it and make various changes.
You can make two types of graphs in one. To do so, select on of the data sets with the Group Selection tool. Double-click on the graph tool and select the desired type of graph from the icons from the dialogue.
Graph Designs
Let’s start by building our graph before we enhance it with graph designs
Illustrator Graphs really come to life when you replace the bland, greyscale shapes with novel designs. you need to define your design first. Go Object > Graph > Design…
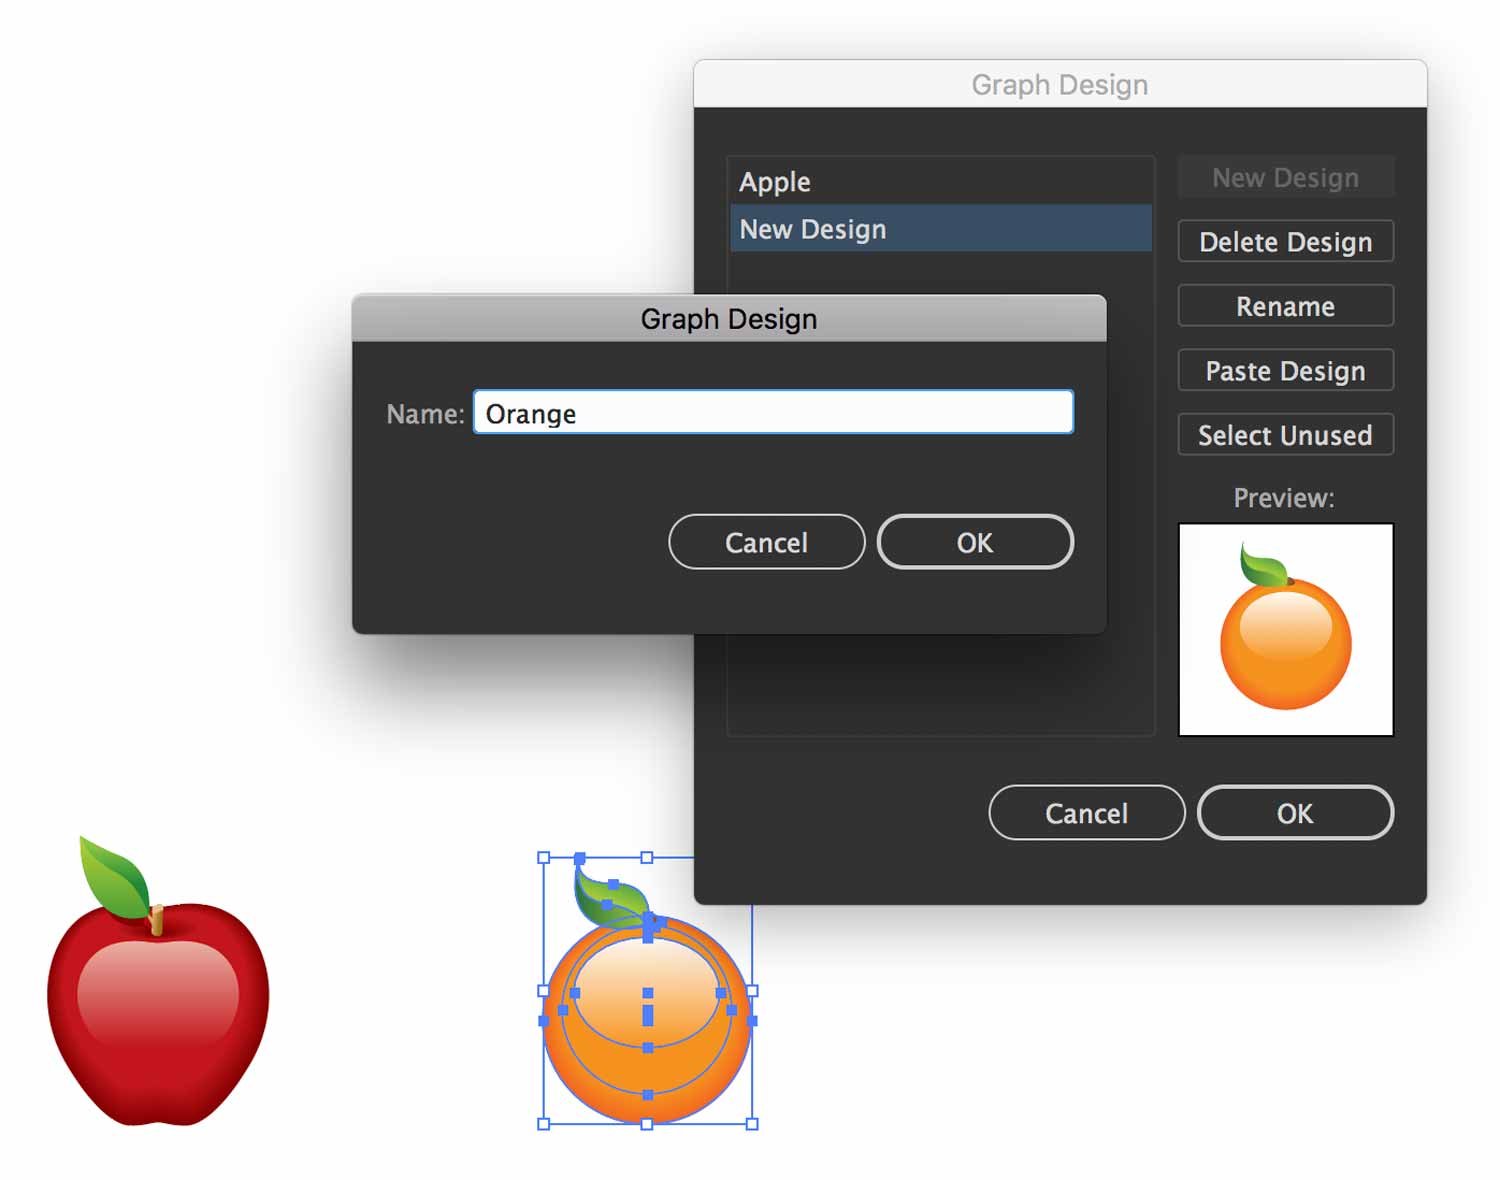
Once you define your design, you need to select a data set to apply the design to. Use the Group Selection Tool. Once it’s selected, go Object > Graph > Column… Choose the settings which suit your graph design.
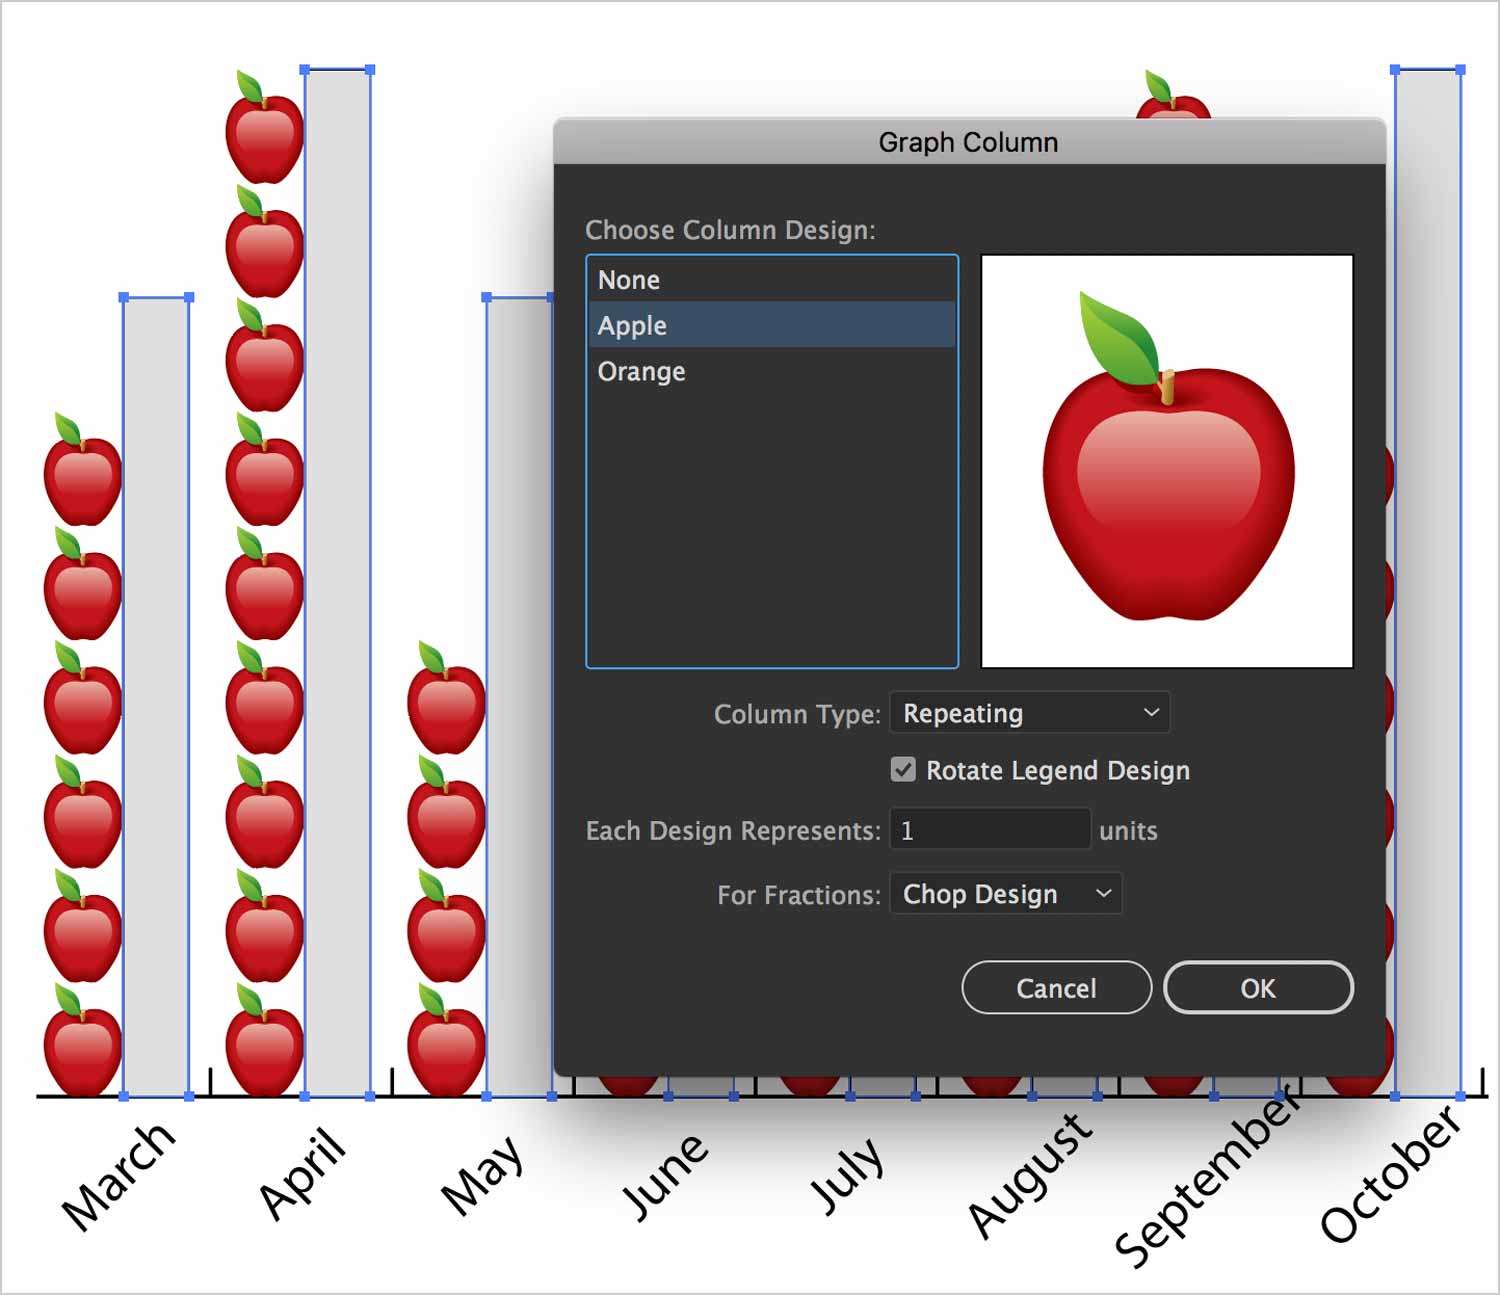
You actually have quite fine control of how the design can stretch. You can determine which portion of the column stretches using guides.
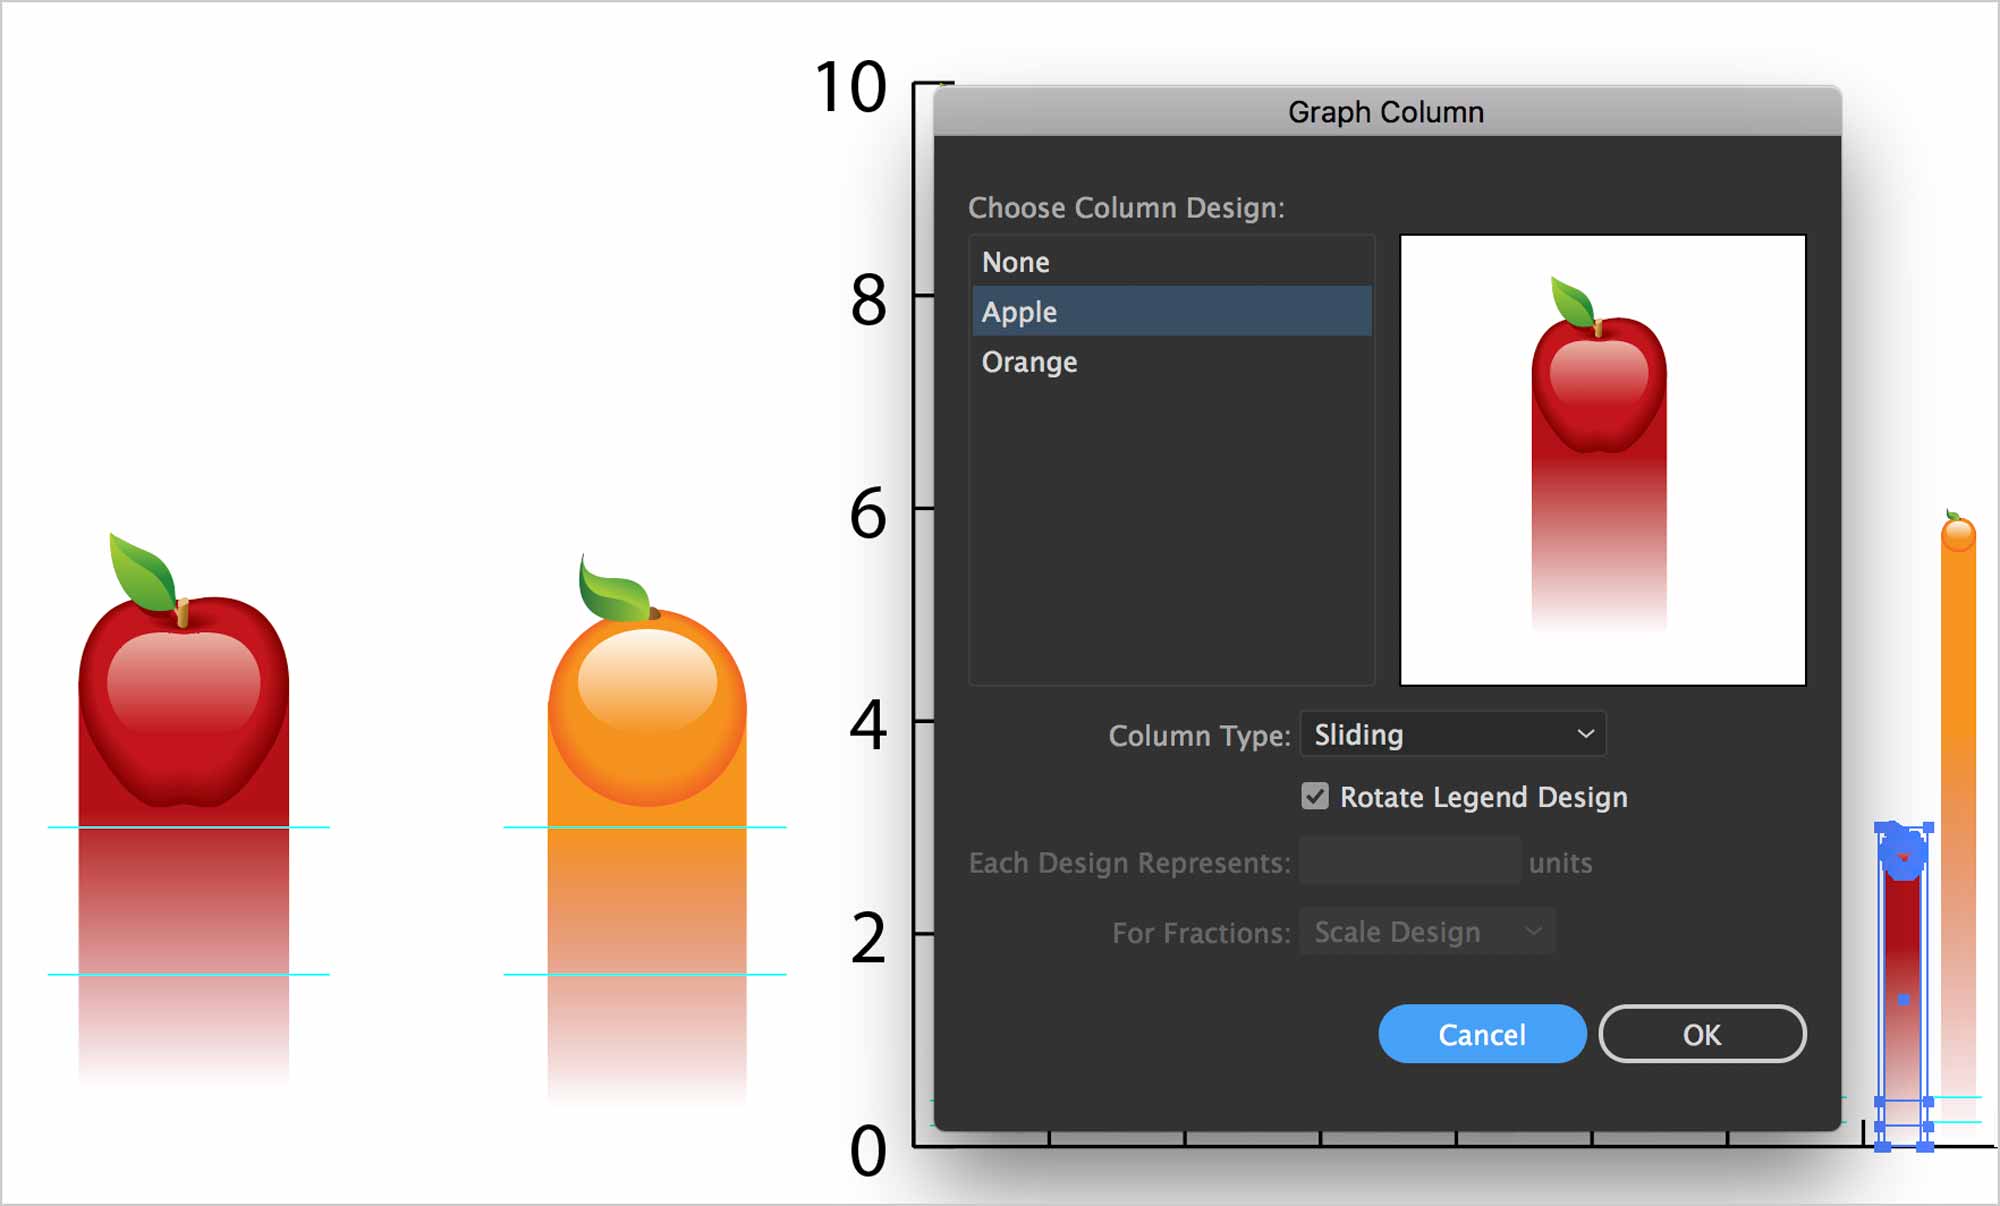
Draw lines where you want the graph to stretch. Convert them to guides using ⌘-5. Make sure the guides are unlocked by hitting Option-⌘-;. Create a new graph design with it set to Sliding, as shown.
Outlining Your Graph for InDesign
When you place an Illustrator graph in an InDesign document, you need to ensure it no longer has depencies on fonts or images.
In a duplicate of your graph file, select your graph and ungroup it with Shift-⌘-G. Illustrator will put up a warning. Click OK. Outline all type by using Shift-⌘-o or Type > Create Outlines.
Make sure to check your Links panel in Illustrator Window > Links to ensure it’s empty. If it’s not, delete any placed images from your file.
You can also check the Find Font dialogue to ensure there’s no live type in your Illustrator document. If so, outline it using Type > Create Outlines.
Wrap-Up
The final product is that you have a live graph in Illustrator. You have a copy of that graph which is outlined. You place the outlined one in InDesign. The end.
Formative Activity
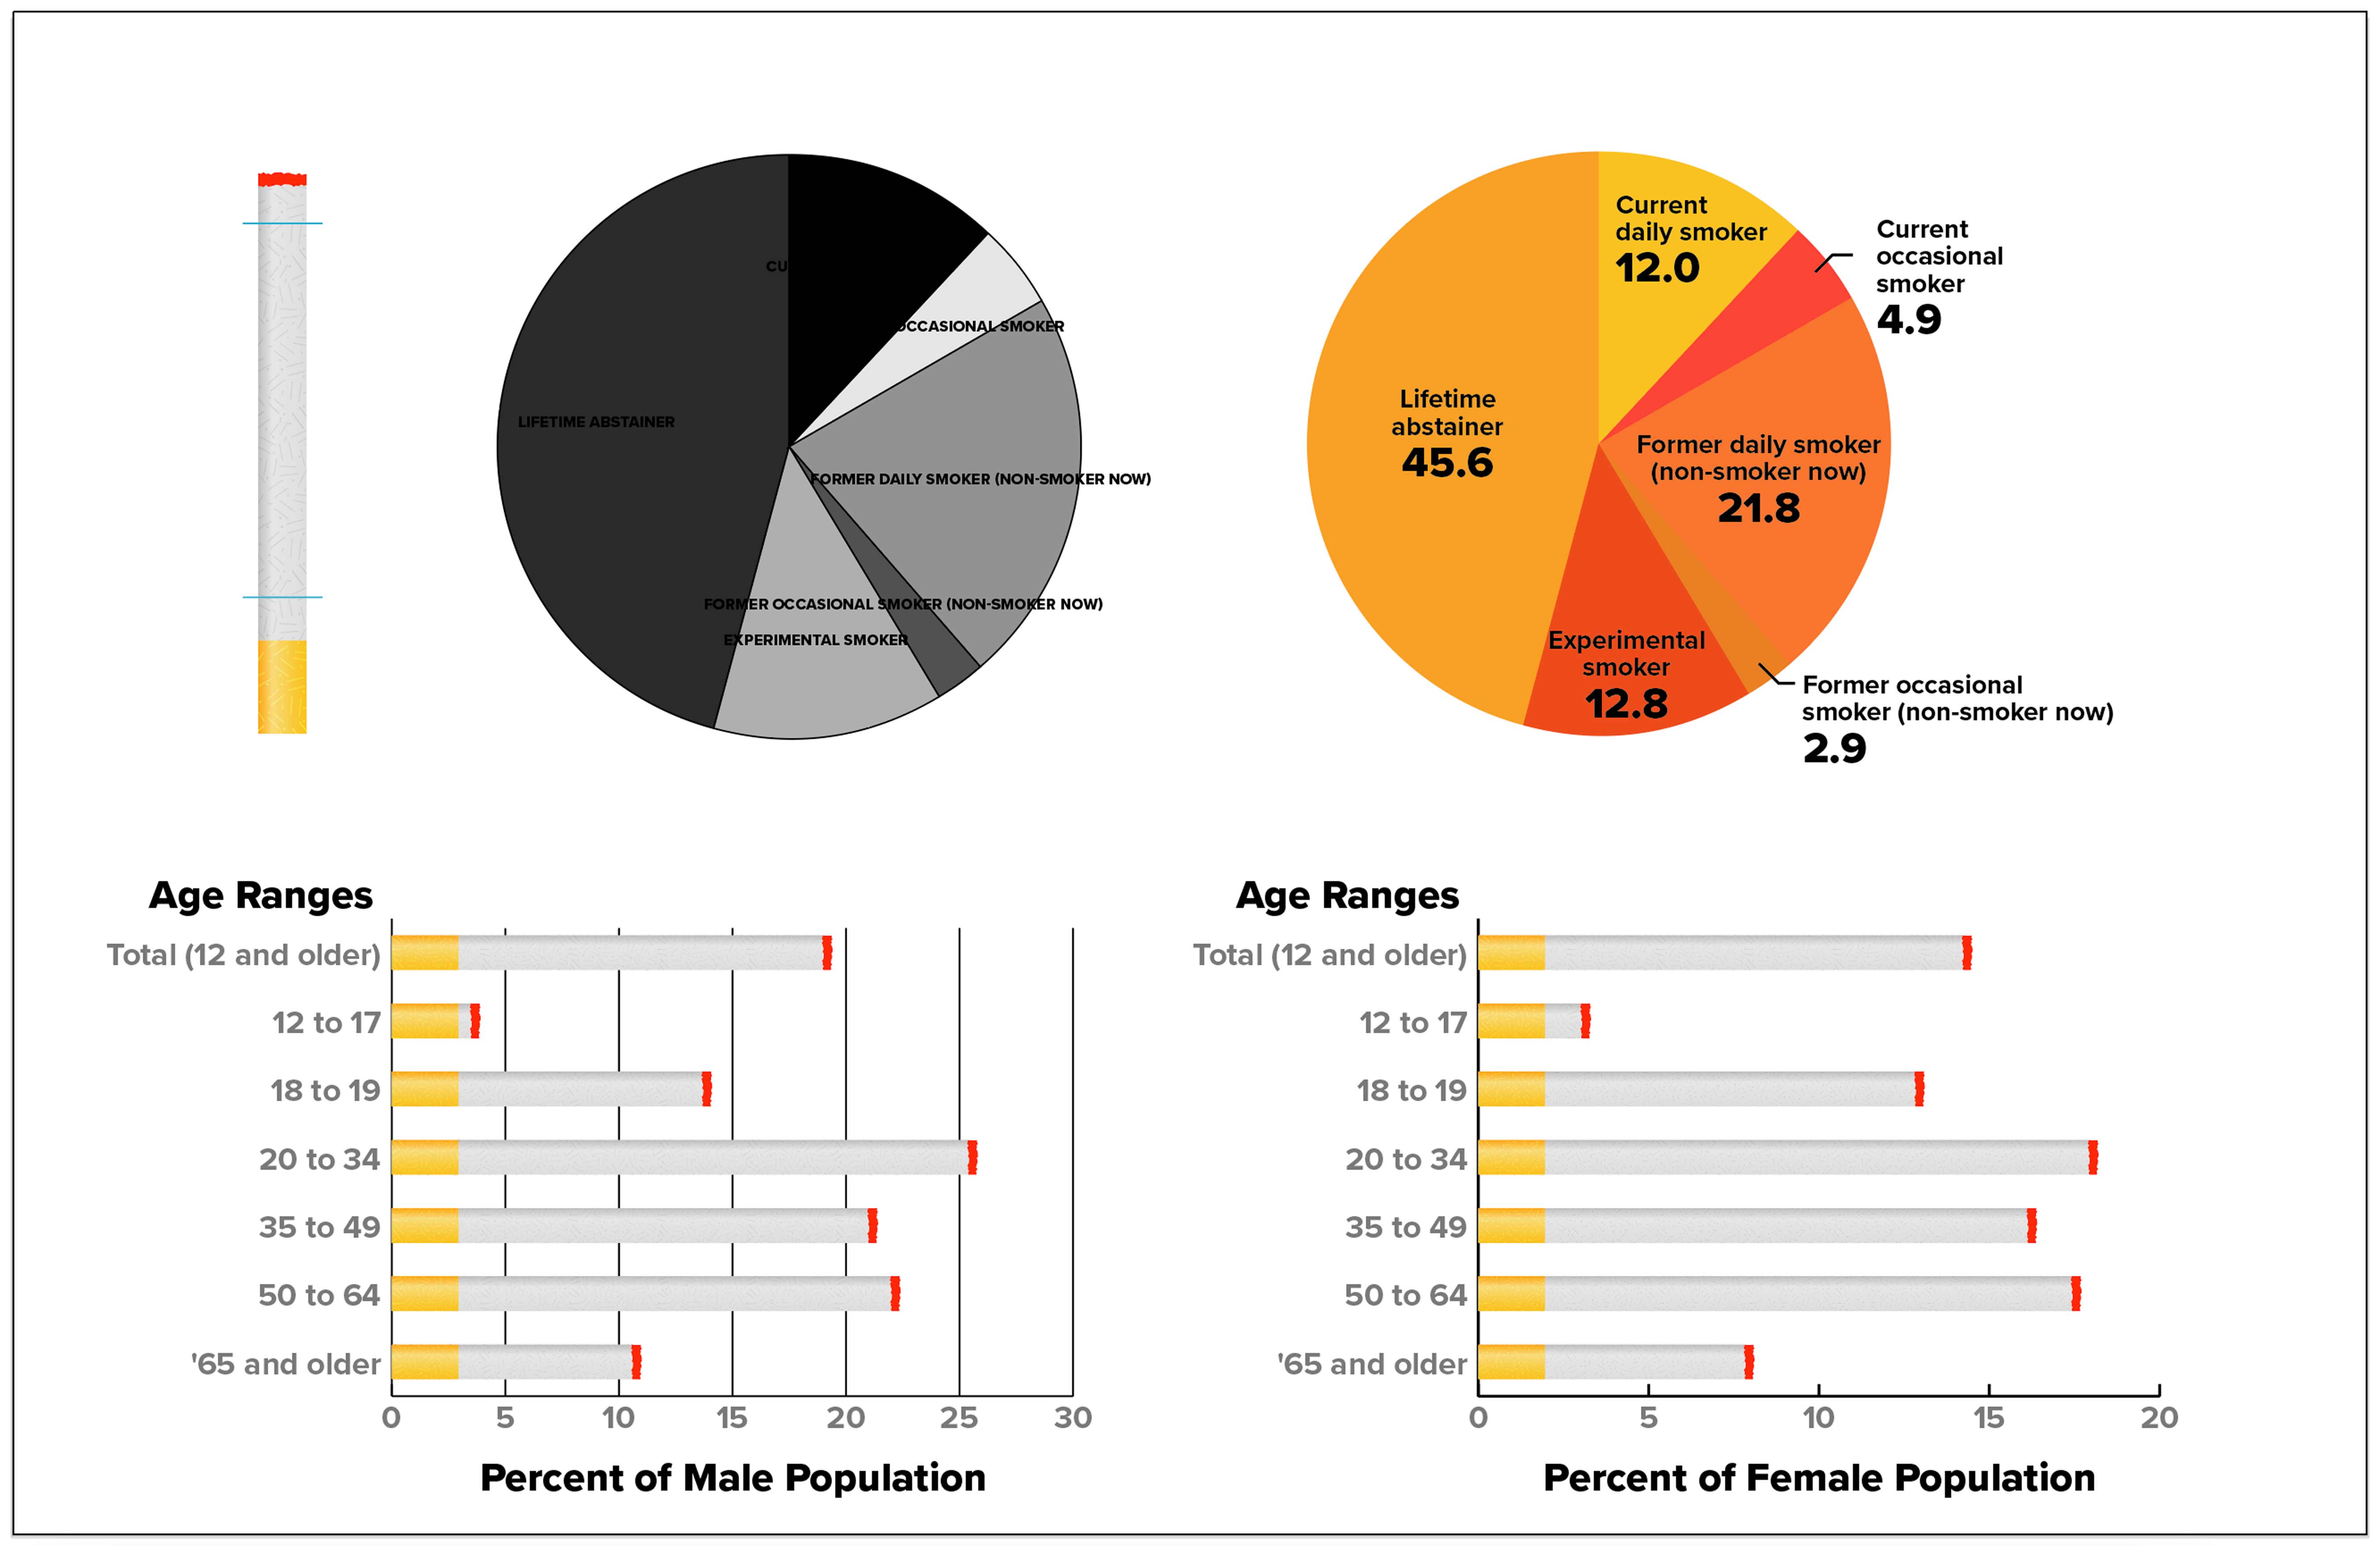
Create graphs with the provided data about smokers in Canada. Make your layout a tabloid page, in either landscape or portrait orientation.
Graphs
Create a bar chart depicting the number of smokers in Canada — for men and for women. Your chart must be a sliding bar chart. It can be horizontal or vertical.
Create a pie chart with the provided data. Customize it at will.
InDesign Layout
Create duplicate, outlined versions of your graphs that’ll be placed in your layout in InDesign.
My Design
This is what I did for this exercise. Feel free to mimic my design or create your own. The important thing is to use Illustrator’s graph tools properly.

Be sure to keep live graphs and other live artwork on the paste-board. Also, limit yourself only to Adobe Fonts.
Supplemental Links
- Adobe: Graphs