Topics
Using Variable Data in Illustrator will save you a lot of time and avoid entry errors. It allows you to re-use the same artwork with different data in it. A good example would be to output business cards for a company for hundreds of different individuals.
Create a Workspace
Before we get started, we’ll create a Variable Data workspace in Illustrator.
- Type Shift-Tab to hide all of your panels.
- Open your Layers and your Variables panels.
- Save the workspace as Variable Data.
Types of Variables

Objects such as point type, area type, vector art and placed images are containers for the data stored in the spreadsheet. They’re simply place-holders which will be replaced by each row of data as the file is exported with our Batch Action.

Kinds of Variable Data
Text Variables
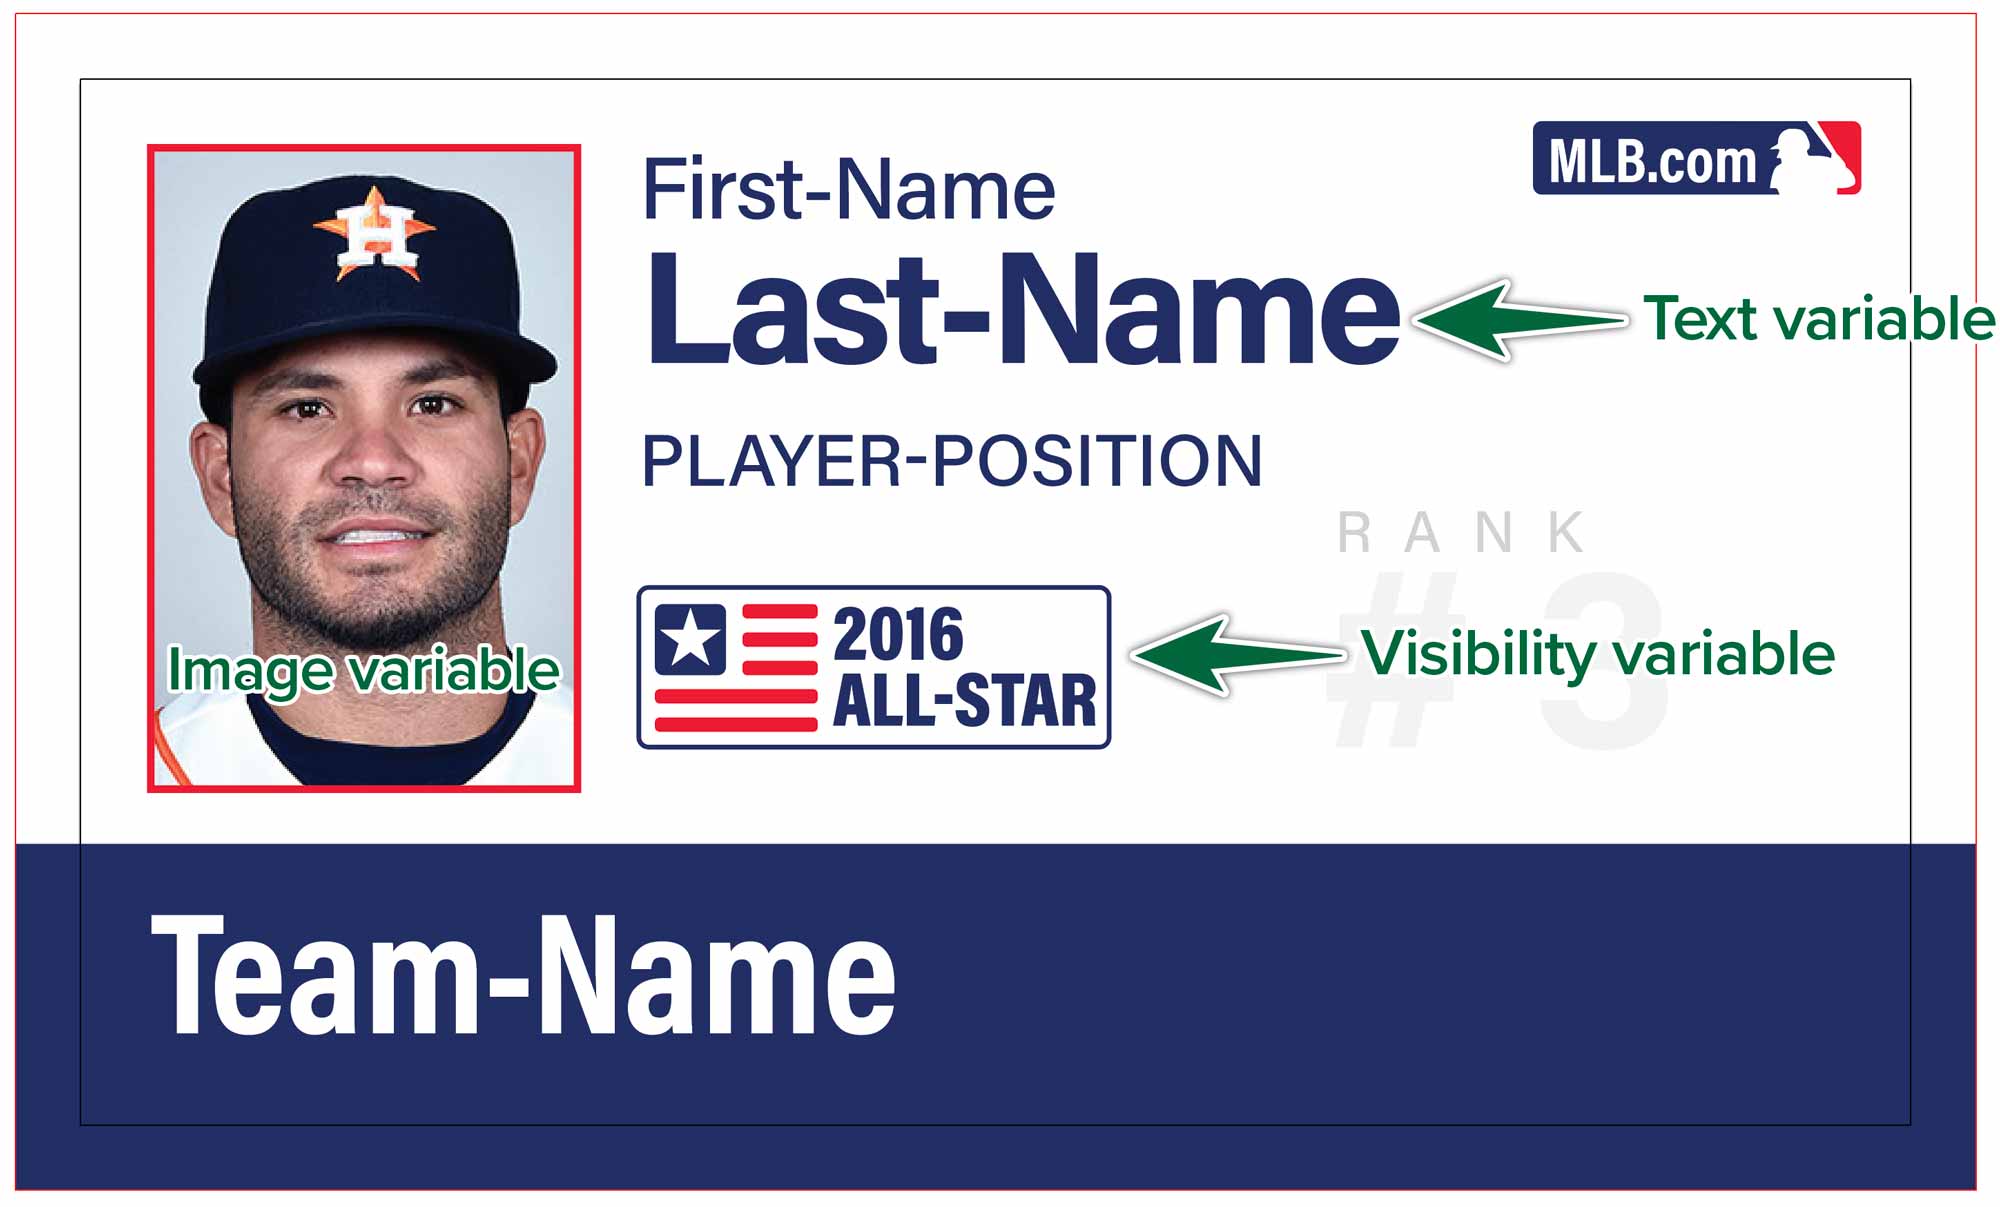
This type of variable looks to the spreadsheet’s rows for text. As it progresses through the rows, it swaps out the text in the Illustrator document for each entry in the data. This is the most common type of variable. It can be point text or area text.
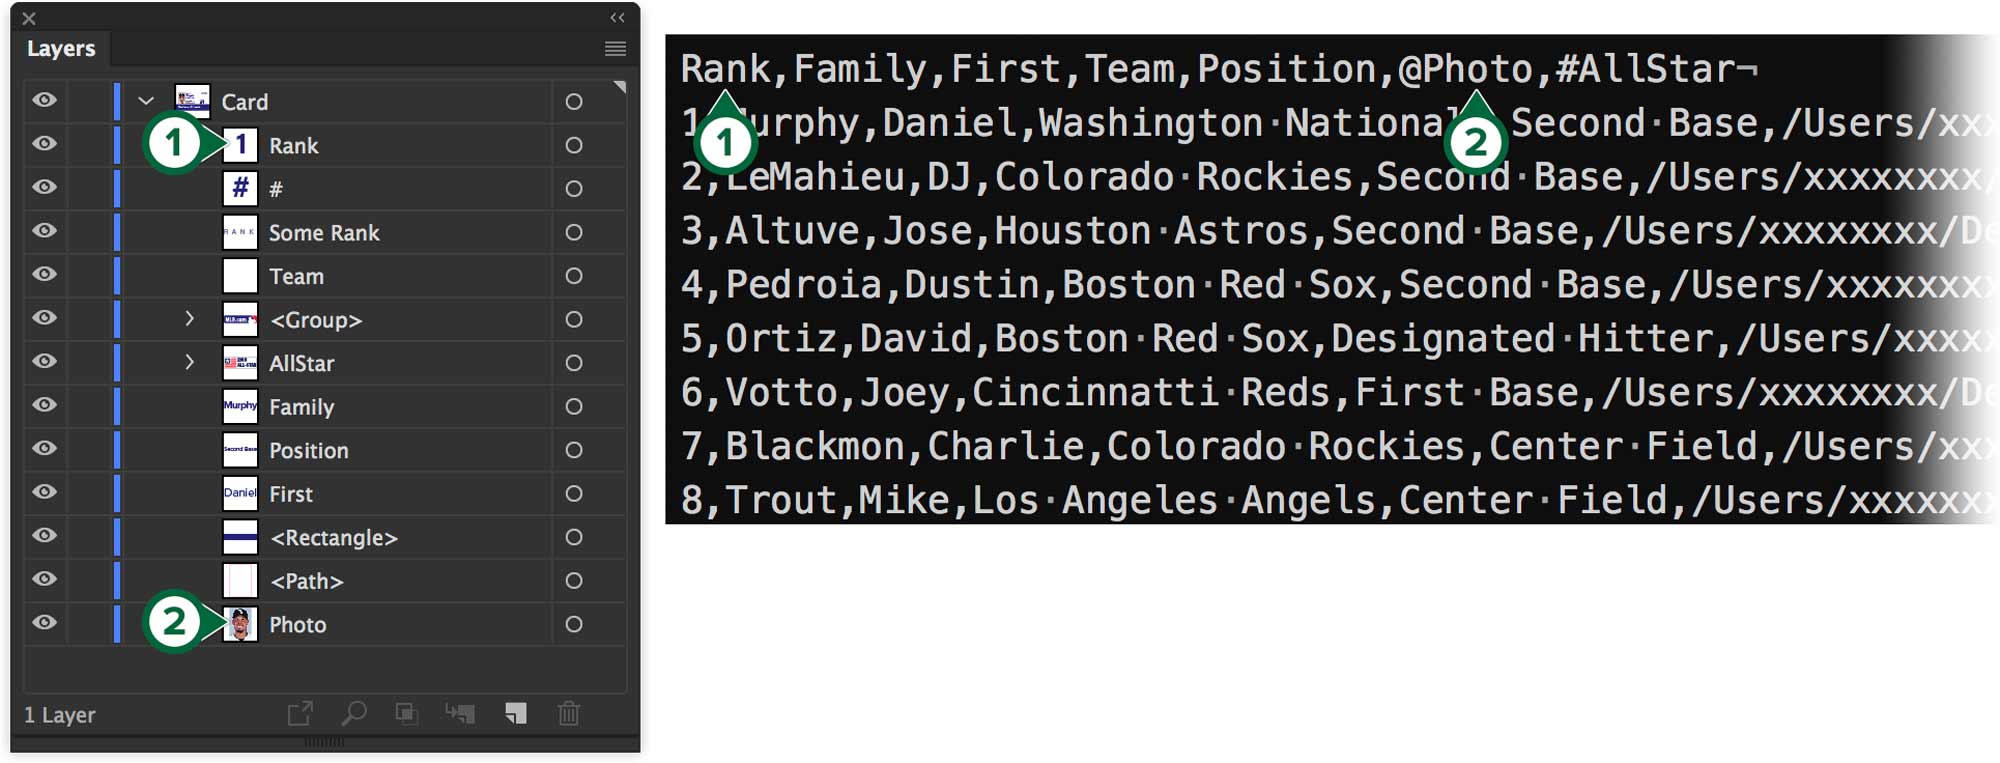
The name of the Illustrator sub-layer for text needs to be named the same as the column in the .csv file.
@ Linked Image Variables
You can swap out placed/linked images based on the data in a spreadsheet. Illustrator will look at the path to an image in the .csv file, then cycle through all your images. The path to the image needs to look like this in your spreadsheet.
/Users/Appleseed/Documents/Projects/Baseball-Cards/images/appleseed.jpg
The name of the Illustrator sub-layer for image needs to be named the same as the column in the .csv file. Add an @ symbol before the column name in the .csv file to indicate that this is an image variable.

# Visibility Variables
This is artwork we wish to reaveal or hide. Visibility is only On or Off. In your spreadsheet, that’s expressed as TRUE or FALSE. Again, the header for a visibility variable is prefixed with a # symbol. This is how you show or hide objects on the artboard.

The name of the Illustrator sub-layer for this content needs to be named the same as the column in the .csv file.
% Graph Variables
You need to create an Illustrator Graph to start. The graph data for each record must be saved in a text file. Each file contains the data from the Illustrator Graph Data panel. So you need to copy the data from that Illustrator panel into a spreadsheet. The data needs to be separated by tabs and not commas.
We won’t be dealing with graphs today for a lack of time. You can read more about adding graph variables at the provided Adobe support link.
Editing Your Data
We’ll need a properly formatted spreadsheet in order to create the multiple files from our data. We’ll set this up here.
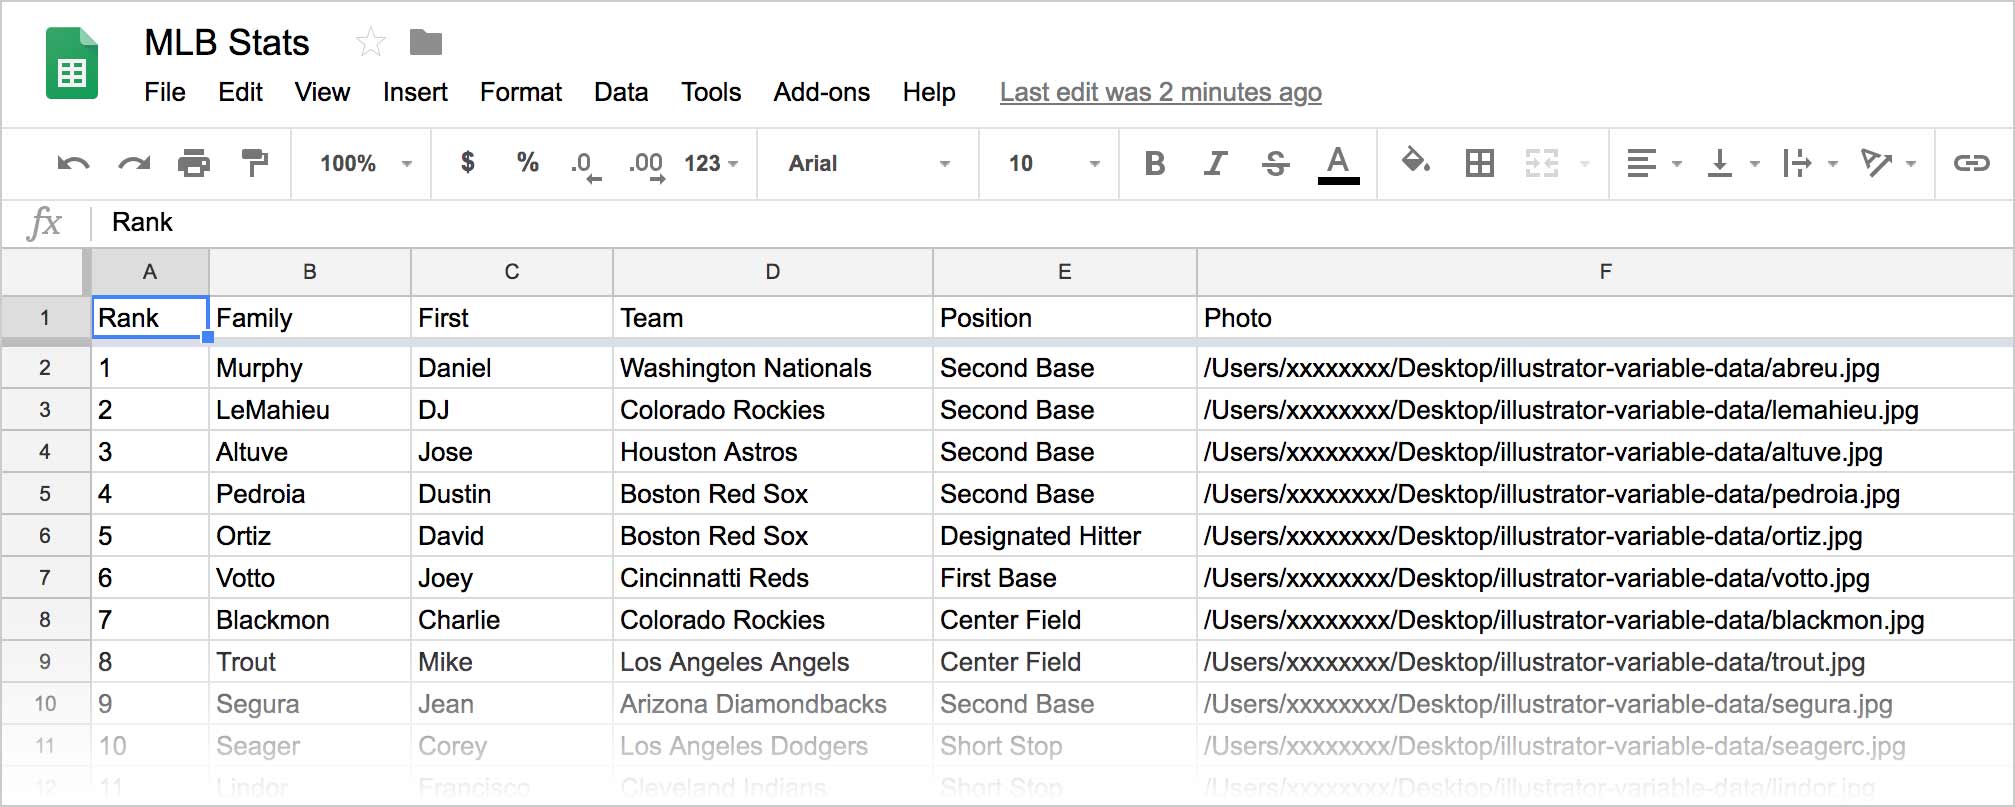
In our spreadsheet, columns are variables. Rows are the data sets which contain those variables. When showing the next data set in Illustrator, we’re just moving to the next row in the spreadsheet. Each coloumn represents an object on your Artboard. Column heads cannot have spaces or special characters. They should be readable and descriptive.
- An @ symbol before the column name represents an image.
- The # symbol before the column name represents a visibility variable.
- A % sign before the column name represents a graph.
Go to the Google spreadsheet from this link.
Important Notes
- The data field names in your spreadsheet should not contain blank spaces. For example, you can specify the data field as Company_Name instead of Company Name.
- Similarly, the paths referring to image and graph files should not contain any blank spaces. For example, the path of an image file should be /Users/Appleseed/Photos/BillTucker instead of /Users/Appleseed/Photos/Bill Tucker.
- All graph files linked from your data source file should be saved as comma-delimited (.csv) files.
- If you get an error message when you type the @ symbol at the beginning of the field, type an apostrophe (') before the @ symbol (such as '@Photos) to validate the function. Some applications, such as Microsoft Excel, reserve the @ symbol for functions.
- The .csv file needs to be saved with RTF-8 encoding. Apple's Numbers app will do this automatically.
Layers → Columns
We need to make sure that the Illustrator art is named the same as the column names in the data file.

Hooking Up Your Data
Now that we have a properly formatted data file in .csv format, we can connect it to our Illustrator document. Open the Illustrator file, then go Window > Variables to get your Variables panel.

- Name sub-layers like column headings.
- Open the Variables panel.
- Import your .csv file.
- Link the variables to the objects on the page.
Click the Import button in the panel. Choose your .csv file. The variables will appear in the panel. Now, we select objects on the artboard and click the appropriate buttons in the Variables panel to connect them.
Preview Documents
Now that the data is connected to artwork in Illustrator, we can preview the documents. In the Variables panel, choose a data set from the dropdown menu. You can now click the left and right arrows to cycle through all the entries in the csv file. The content should change with each entry and some artwork should show/hide, too.
Exporting Data Sets
We’ll use an Illustrator action in a batch to export each record.
- Name a new action as ‘Save Data Set as PDF’.
- Choose File > Save a Copy…
- Don’t change the file name.
- Choose PDF as your file format.
- Choose PDF settings to suit your needs.
- Make sure ‘View PDF after saving’ is checked off.
- Click Save PDF
- Stop recording
Now we’ll use the Batch command to run the action on our data sets.
- Go to the Actions panel and choose Batch… from the flyout menu.
- In the ‘Source’ dropdown, choose ‘Data Sets’.
- In ‘Destination’, choose ‘None’. Choose a destination.
- For ‘File Name’, choose ‘Data Set Name’ as long as you know your data sets all have unique names.
- Finally, choose an error reporting option. Click ‘OK’.

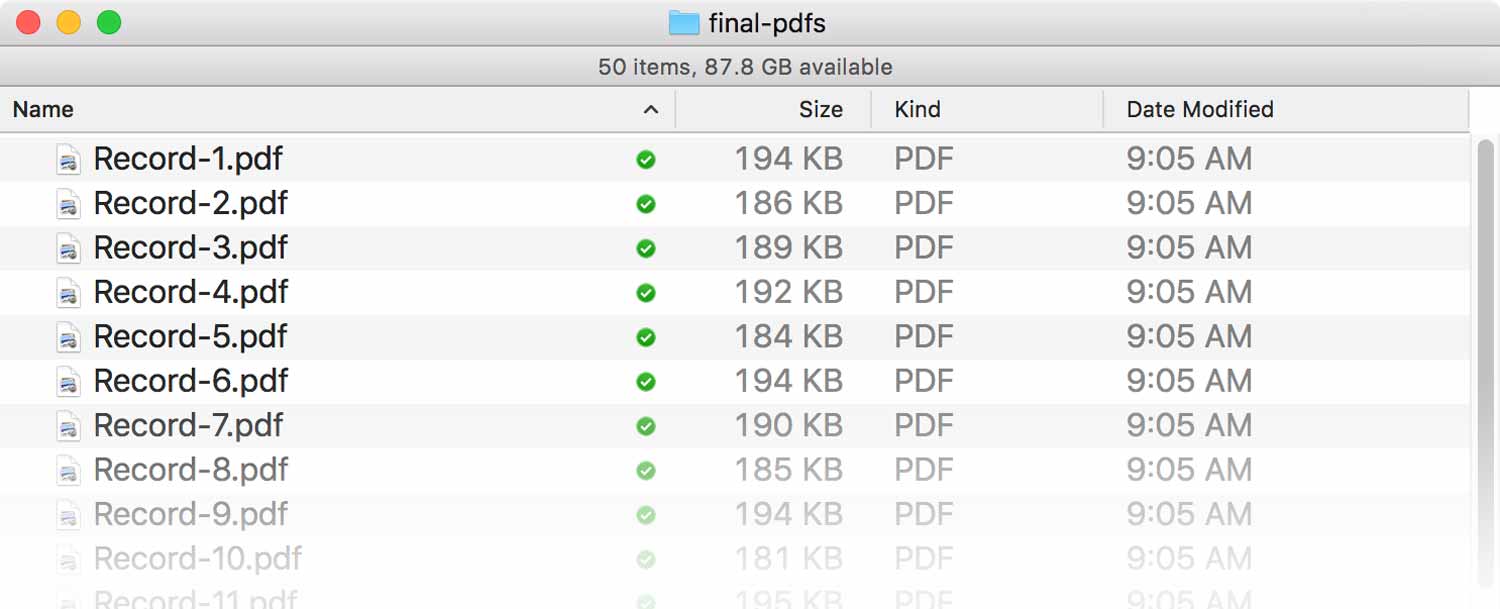
This batch process will save a series of PDF files where you tell it to. Voilà! You’re done. Now you have the skills and knowledge to create dozens, if not hundreds of Illustrator files with variable content.
Formative Activity
As our formative assignment, let’s create cards for each of the provided baseball players. Each card will have variable text, a photo for each, and some will have an All-Star graphic.
We’ll output the final cards as separate PDF files.
Supplemental Links
- Adobe: Variable Data


